
NEW Q POLL: Christie Trails Clinton in Hypothetical Keystone Match Up Partly Due to Weak GOP Support
By Matt Rooney | The Save Jersey Blog
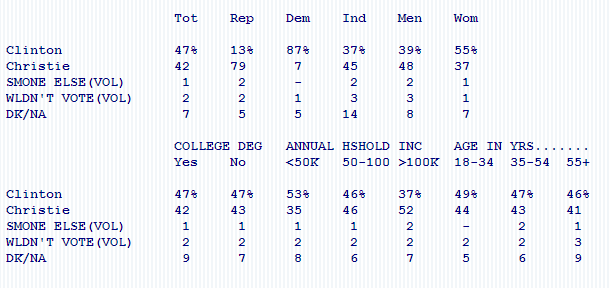
Did you catch it? Quinnipiac had a new poll out late yesterday showing Chris Christie trailing Hillary Clinton in a hypothetical 2016 match up across the Delaware River in Pennsylvania. The essential crosstabs for your review, Save Jerseyans:
Pretty interesting, right?
A couple things jump out at me, notably, how Governor Christie is winning Independents but drawing only 79% support from surveyed PA Republicans. 13% of Republicans went with Clinton, and 9% fall into the not sure and/or not backing Christie column.
It’s a long way out, it’s only one poll and, to be fair, Christie performs better than other Republicans included in the poll questions (including Paul Ryan and Marco Rubio). But with demographics being what they are in modern America, Chris Christie can’t win nationally in 2016 (barring an unforeseen political realignment) with weak GOP backing, folks… is it more post-Sandy blow back?
I’d like to hear what YOU think on this one. If you want to delve deeper, this Q poll’s sample is below the fold…
====================
PA0313 Demographics
====================
From March 6 – 11, 2013 Quinnipiac University surveyed 1,116 registered voters
in Pennsylvania with a margin of error of +/- 2.93 percentage points.
PARTY IDENTIFICATION – Generally speaking, do you consider yourself a Republican,
a Democrat, an Independent, or what?
REGISTERED VOTERS
Weighted
Percent
PARTY IDENTIFICATION
Republican 34%
Democrat 37
Independent 24
Other/DK/NA 5
PHONE DISTRIBUTION
Cell only 20%
Land Line only 9
Both, cmp from cell sample 13
Both, cmp from land sample 59
RACE
White 84%
Black 9
Hispanic 2
Other/DK/NA 5
REGISTERED VOTERS……………………………..
Tot Rep Dem Ind Men Wom
Weighted Percentage 100% 34% 37% 24% 48% 52%
MoE (+/-%) 2.93 4.99 4.98 5.74 3.99 4.33
COLLEGE DEG ANNUAL HSHOLD INC AGE IN YRS…….
Yes No <50K 50-100 >100K 18-34 35-54 55+
Weighted Percentage 30% 69% 42% 26% 18% 20% 32% 45%
MoE (+/-%) 4.31 4.02 4.69 5.71 6.48 9.34 5.77 3.75
Alghny Philly NthEst SthEst NthWst SthWst Cntrl
Weighted Percentage 10% 12% 13% 19% 8% 11% 28%
MoE (+/-%) 8.34 10.69 8.47 6.62 9.80 8.98 5.46
Click here to read the full results.


We are so far from D-Day 2016 that polls like this are premature to say the least. But I am encouraged rather than discouraged by the numbers. After all it really is a matter of a few points- considering all the name recognition the Clintons have and considering Hillary never really has run anything. Remember all she has done is the senate- where she ran a staff of a few dozen and vote Yay or Nay. The election was a giveaway to her -wrapped in a bow. Then she became the traveling Secretaryof State around the world in four years- under her watch Benghazi and the fall of Egypt , Libya and Syria to radicals.
She lost her one real campaign to a relative newcomer even though everyone thought there was no way she could lose. Bring her on in 2016 and put Michelle Obama at the bottom of the ticket. My odds are with the Governor who has managed a State that was unmanageble.